Metrics Using Prometheus
Metrics collection with Prometheus relies on the pull model, meaning that Prometheus is responsible for getting metrics (scraping) from the services that it monitors. This is diametrically opposed from other tools like Graphite, which are passively waiting on clients to push their metrics to a known server.
Exposing and scraping metrics
Clients have only one responsibility: make their metrics available for a Prometheus server to scrape. This is done by exposing an HTTP endpoint, usually /metrics, which returns the full list of metrics (with label sets) and their values. This endpoint is very cheap to call as it simply outputs the current value of each metric, without doing any calculation.
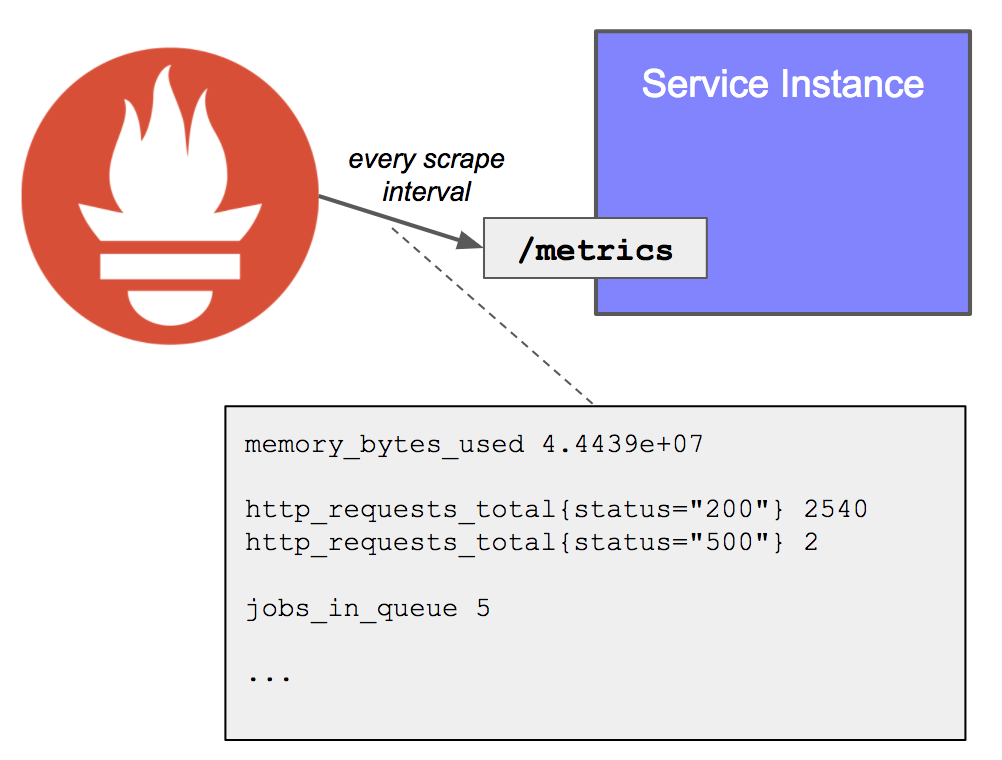
On the Prometheus server side, each target (statically defined, or dynamically discovered) is scraped at a regular interval (scrape interval). Each scrape reads the /metrics to get the current state of the client metrics, and persists the values in the Prometheus time-series database.
Implementation in FastAPI applications
Thats Work by adding a Middleware to your FastAPI application, work on collecting prometheus metrics for each request, and then to handle that we need a function get_metrics work on handling exposing the prometheus metrics into /metrics endpoint.
from fastapi import FastAPI
from authx.middleware import MetricsMiddleware, get_metrics

app = FastAPI()
app.add_middleware(MetricsMiddleware)
app.add_route("/metrics", get_metrics)